What is the average size of an Android app, or what is the average rating and how many and which permissions are requested by apps? These are some of the questions that might pop in your head when you are when you take a step back and realize that Play Store is a big "bucket of applications".
As part of an ongoing research, I obtained a data-set containing details about more than one million applications originating from Play Store. This sparked the interest of creating some cool graphs from it, while also maybe some of the data can be intriguing from a security standpoint at least.
In the rest of this article we are going to present and comment some graphs generated from that data-set. By applications we define only games and apps from Play Store and not movies, books, series, audio-books etc. Please note that we will simply present the graphs and comment each one shortly, the goal is to simply share them and not an in depth analysis explaining them.
The following statistics are shown:
- Installation Size
- Star Rating + Free/Paid
- Free vs Paid percentage
- Number of apps released per year
- Number of apps updated per year
- Number of apps never updated per year
- Number of apps per creator
- Star Rating for different number of downloads
- Comments count per Star Rating
- Number of apps per category
- Number of permissions requested
- Percentages on the different permissions
Installation Size
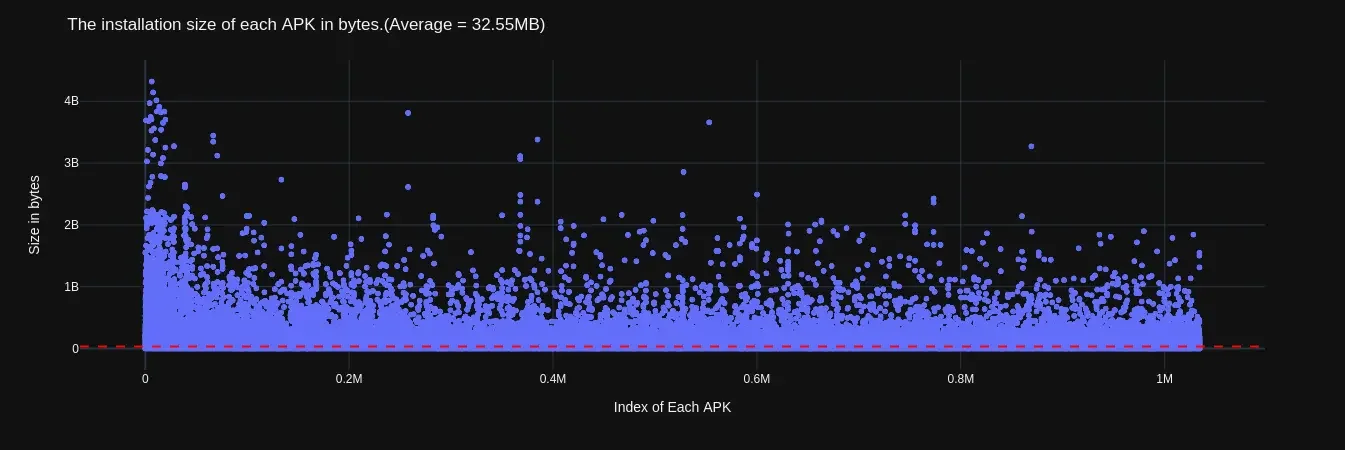
As shown in the figure above, the installation size can vary a lot between the different apps with an average size of approximately 45 Mb.
Star Rating (Free/Paid)
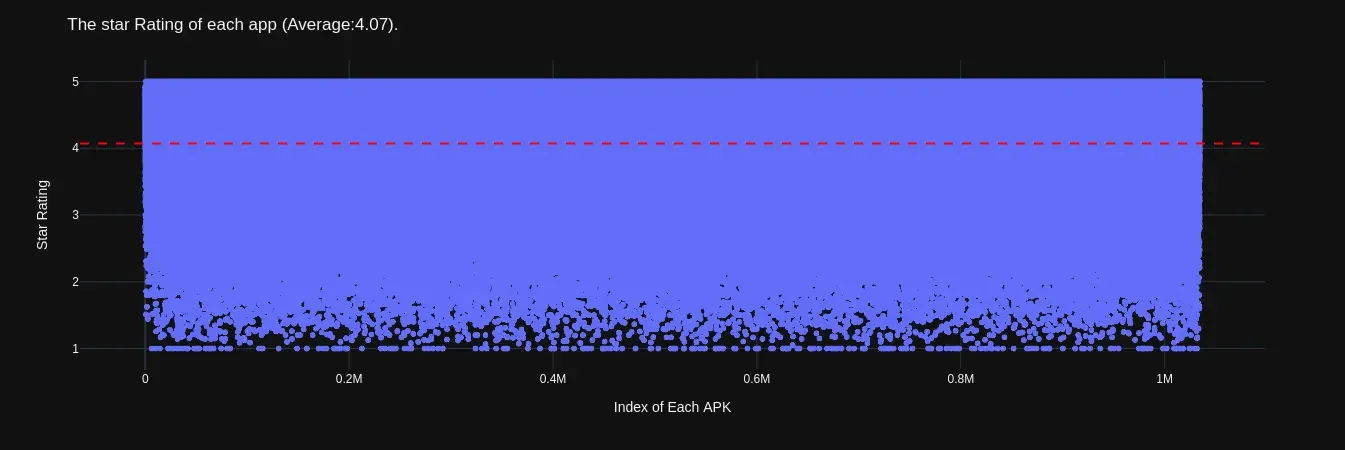
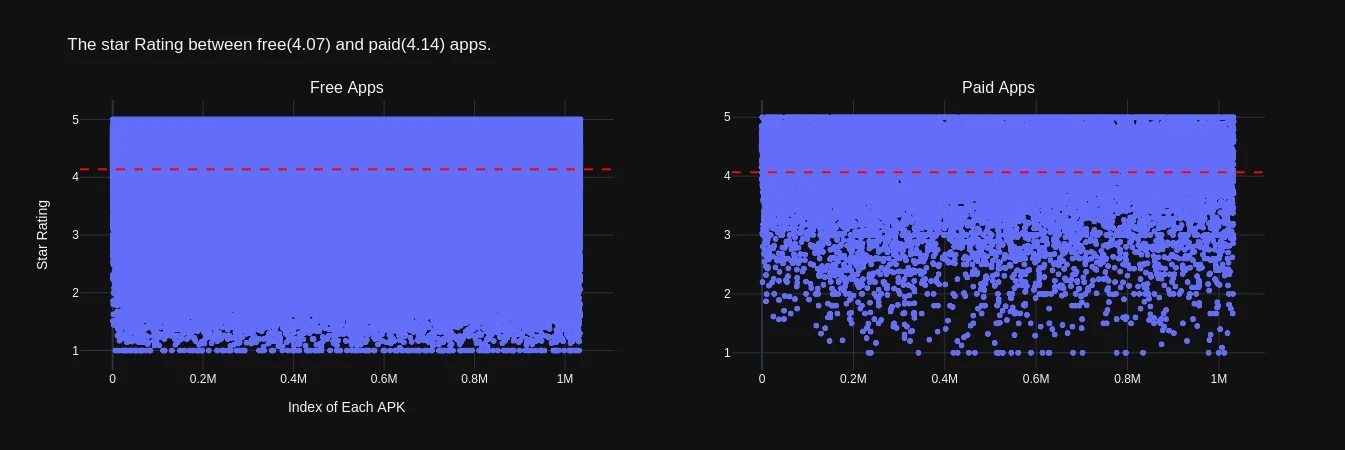
The two figures above show first, the average rating for all applications which is 4.07 out of 5 and in the second one the average if we separate the groups between the Free(4.06) and the Paid(4.19) ones.
Free vs Paid
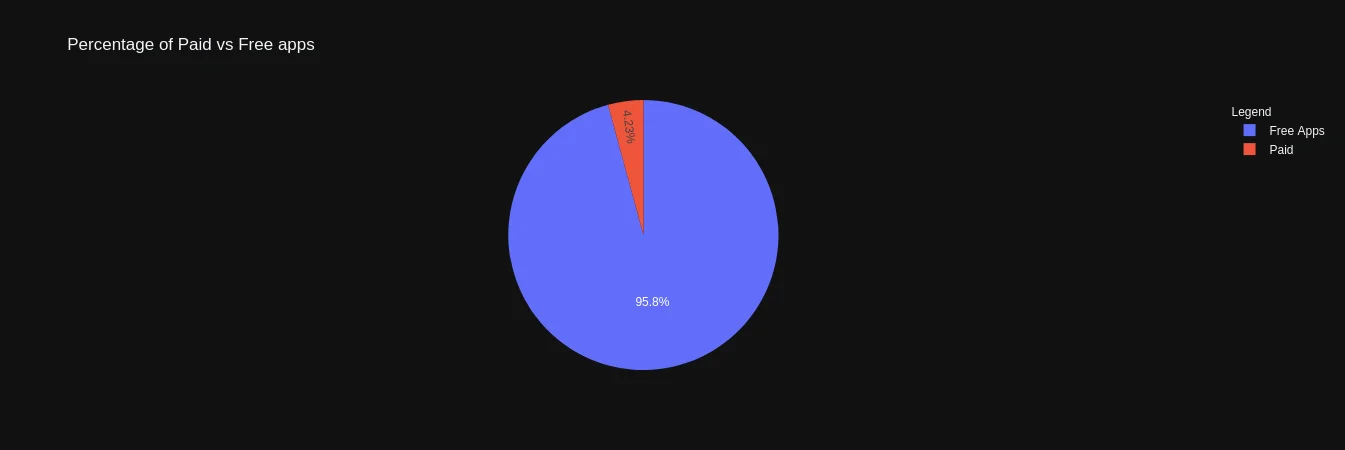
A rather simple graph showing that from our data-set the paid apps are not even the 5% of it.
Number of apps released per year
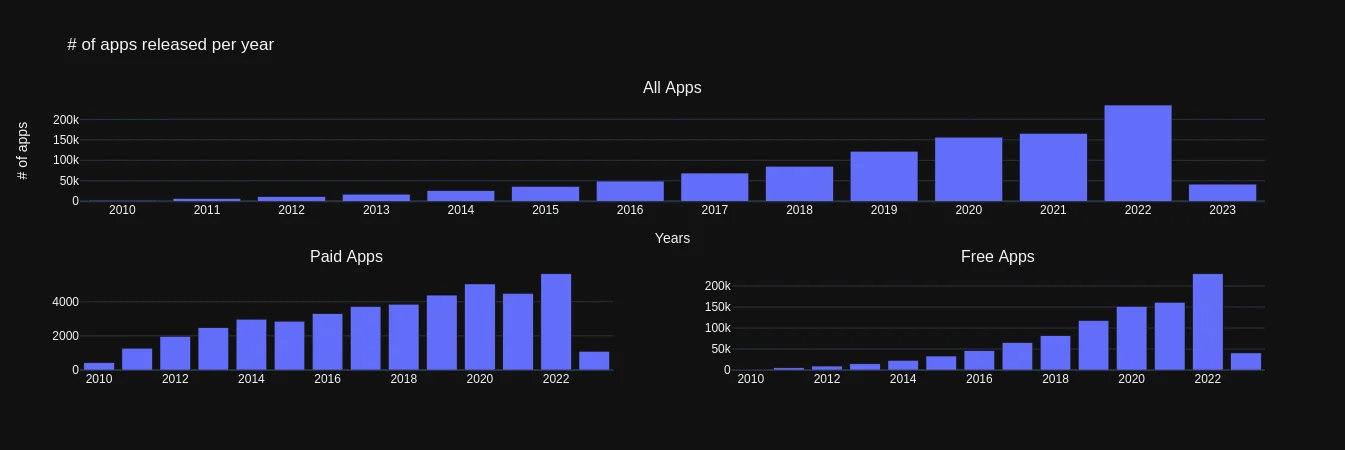
It is interesting to see here how many applications from our data-set were released each year. Also it is nice to see the difference between the free and the paid apps, as it seems that the rate of releases for paid apps did not change as much in comparison to the free apps.
Number of apps updated per year
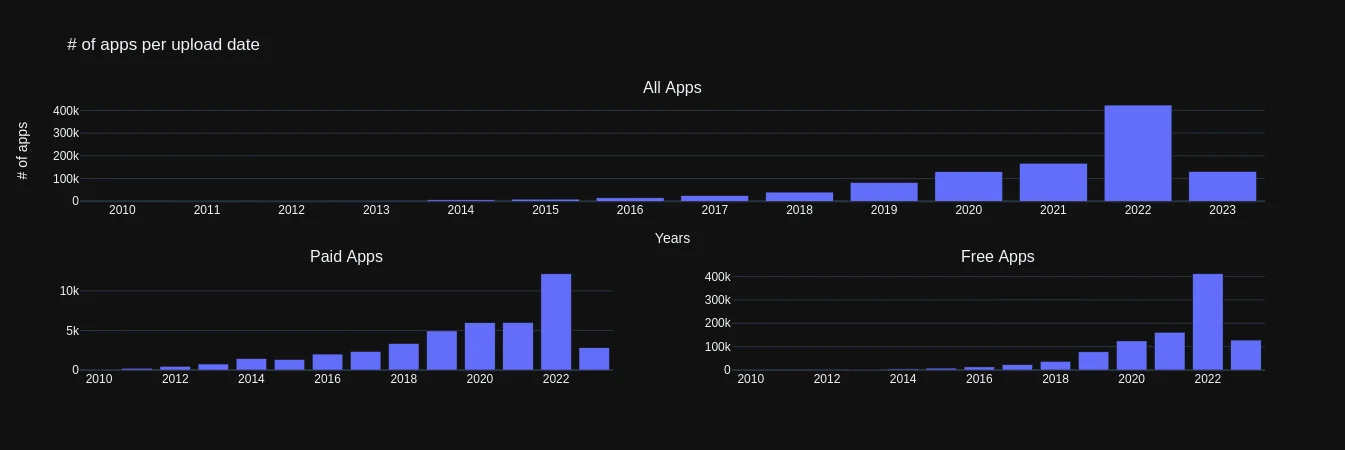
Interesting to see that for all cases the 2022 was by far the year with the more updates for applications. Which leads us to the question, are there perhaps apps that are released and not updated?
Number of apps never updated per year
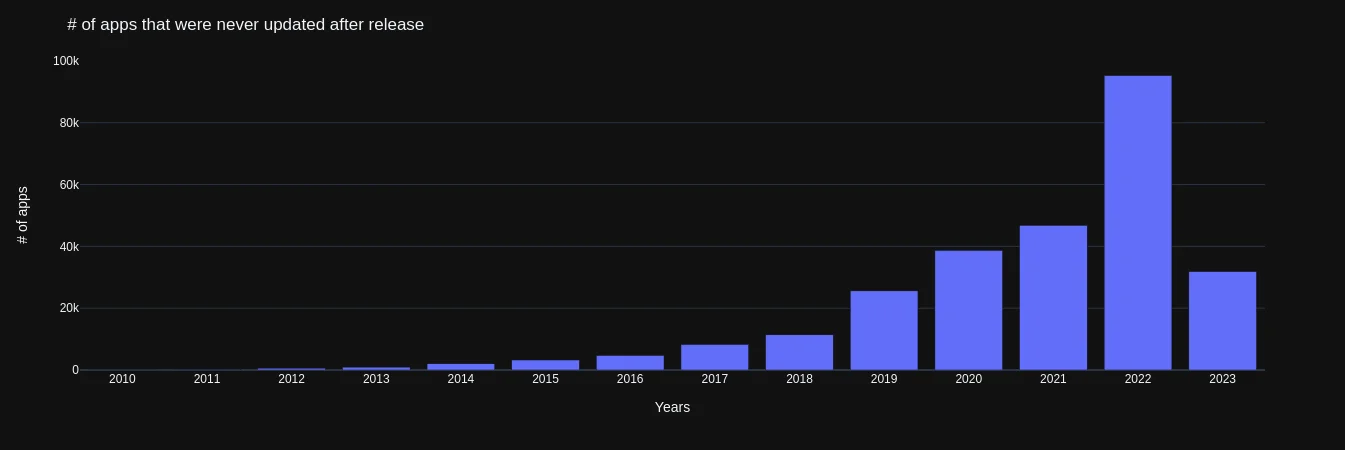
Although we are still early in 2023 we can see how many new releases and updates we have. So for the 2023 it makes sense to have releases but not updates yet as these are new apps. What about the previous years though? We can see that an amount of ~40k apps from 2020 and 2021 were never updated after release. Given how rare it is for an application not to require any kind of update after a release, it might be that a big percentage of these apps are abandoned by their creators.
Number of apps per creator
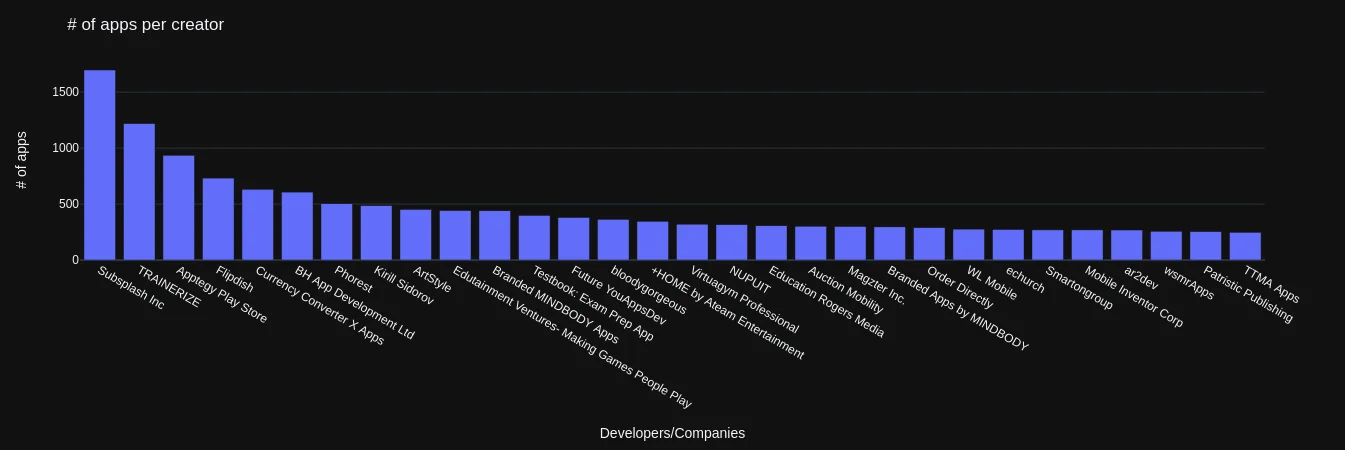
Amazing that there are really a lot of companies/creators with over 200 apps each. Among all these companies the name "Kirill Sidorov" stands out as unless I am mistaken is the only non-company creator in this list with multiple applications.
Star Rating for different number of downloads
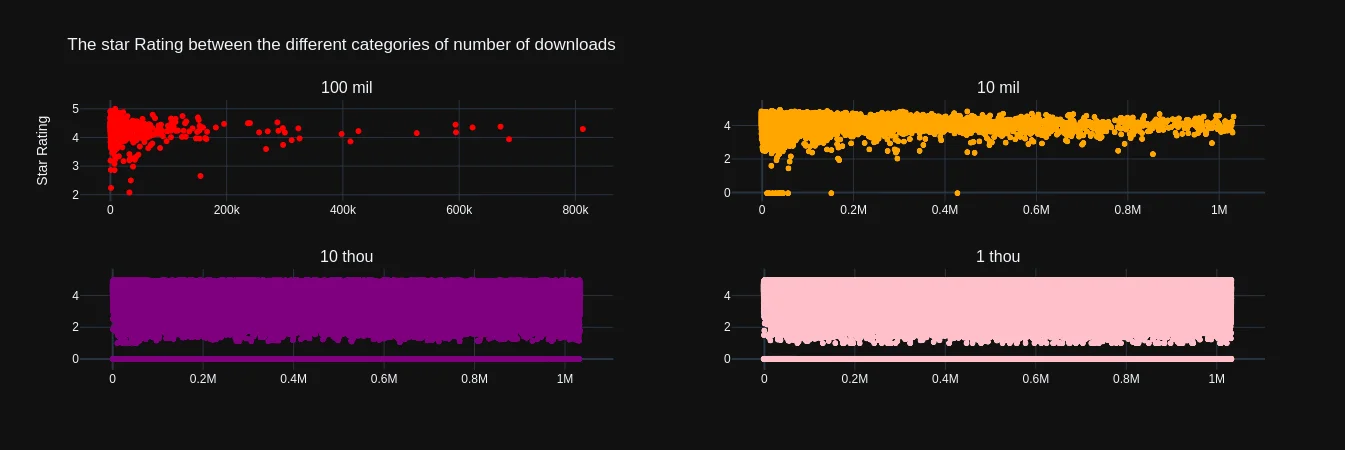
There are two interesting things to notice in this graph. The first is how the two top graphs about the 100 million and 10 million downloads are more concentrated around the star rating of 4, while the bottom two are more spread. If we think about it that makes sense as the more popular an application becomes the more attention is given to it by the developers to improve it further.
The second thing to notice, that can be seen clearly on the first figure of the 100 million downloads, is that they are concentrated not only around the star rating of 4 as we mentioned before but also towards the first 50k positions. The apps were collected mimicking the behavior of a normal user, which means that Play Store itself would promote applications that have higher chances to be liked by the user. Applications that have already a high number of downloads are of course very likely to be liked by other users and so are being promoted by Play Store and therefore introduced to the user before others.
Comments count per Star Rating
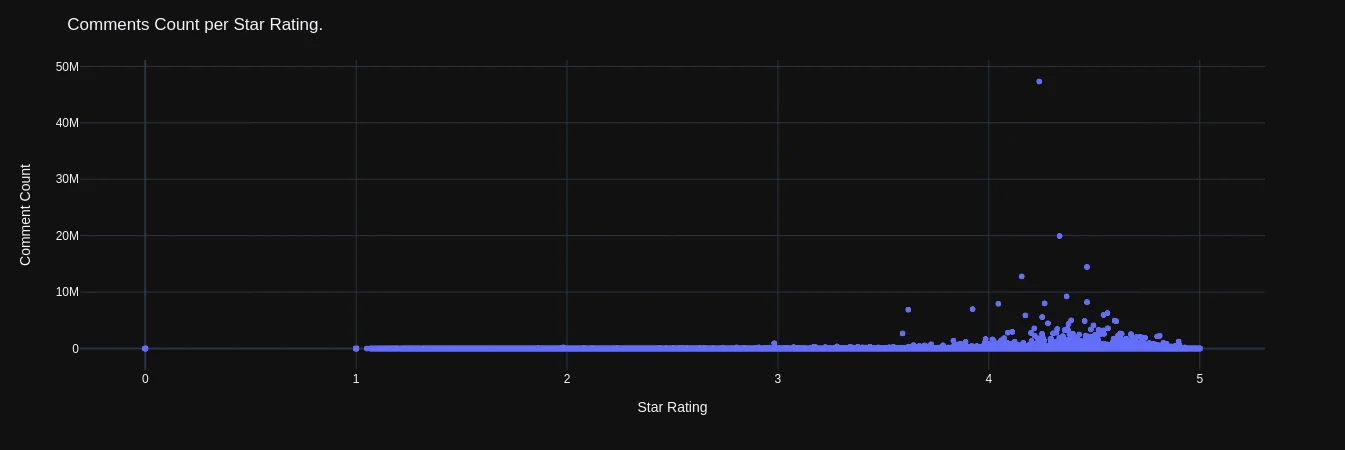
Another rather simple and expected graph, which shows that we have a higher comment count for applications that have high star rating. Around the 4.5 star rating we can see applications with several million comments.
Number of apps per category
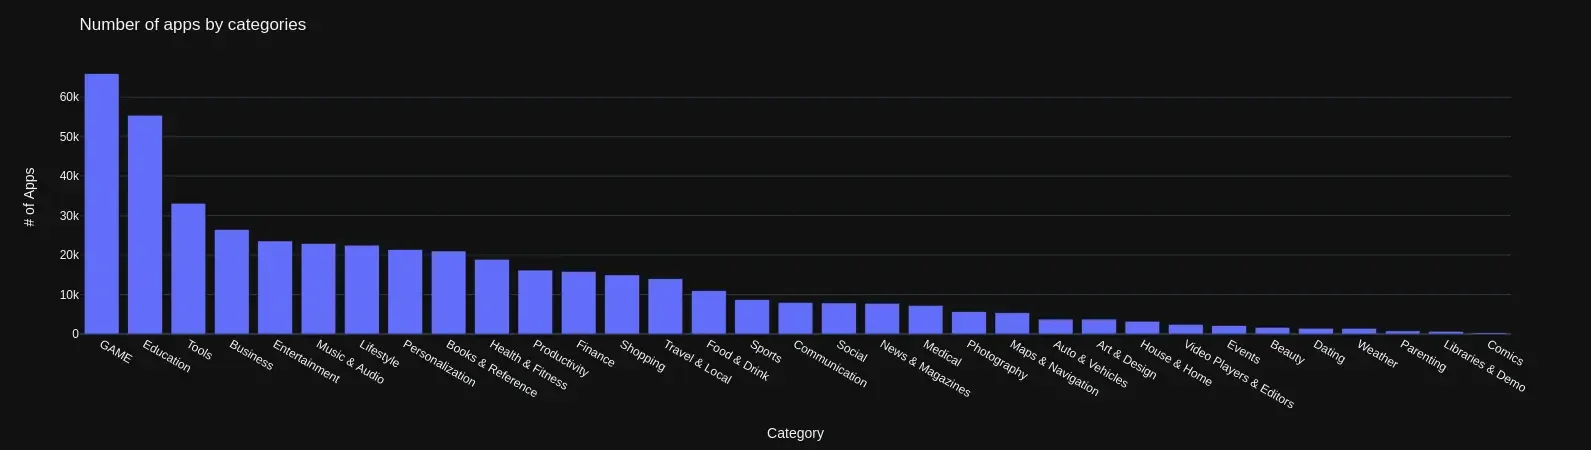
Of-course the games in that category win by a lot any other single app category and the category of "Education" comes second, which was a surprise to me, as I was expecting something "fancier" to be there.
Number of permissions requested
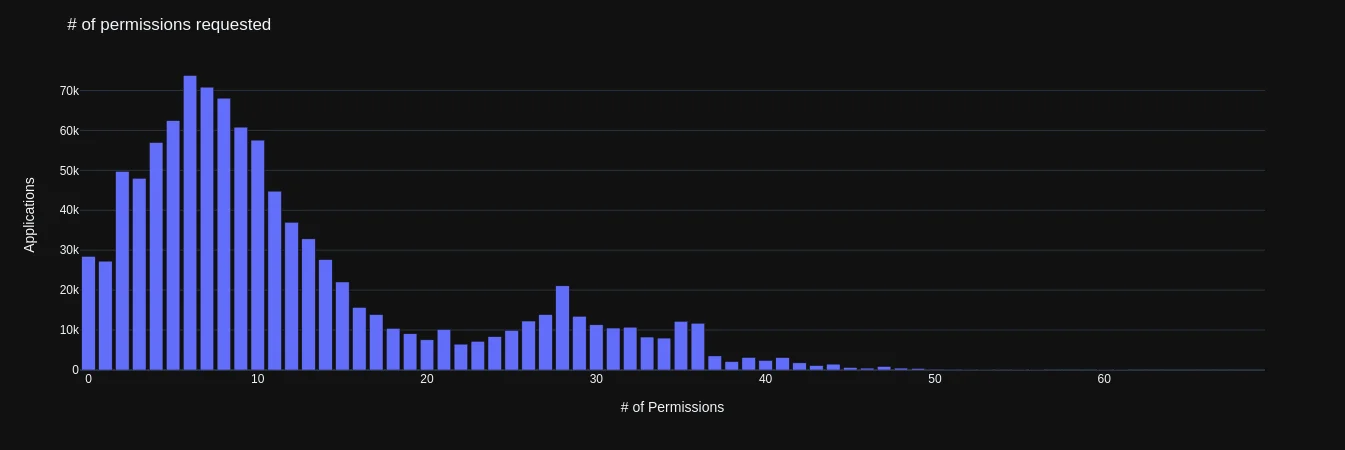
A very interesting graph especially from a security perspective. It shows that most apps (bit more than 70k in our data-set) request just 6 permissions, while there are apps cropped from this graph for better appearance, that request more than 200 permissions!
Seeing this graph, makes us question, about the type of permissions requested, which brings us to the following graph:
Percentages on the different permissions
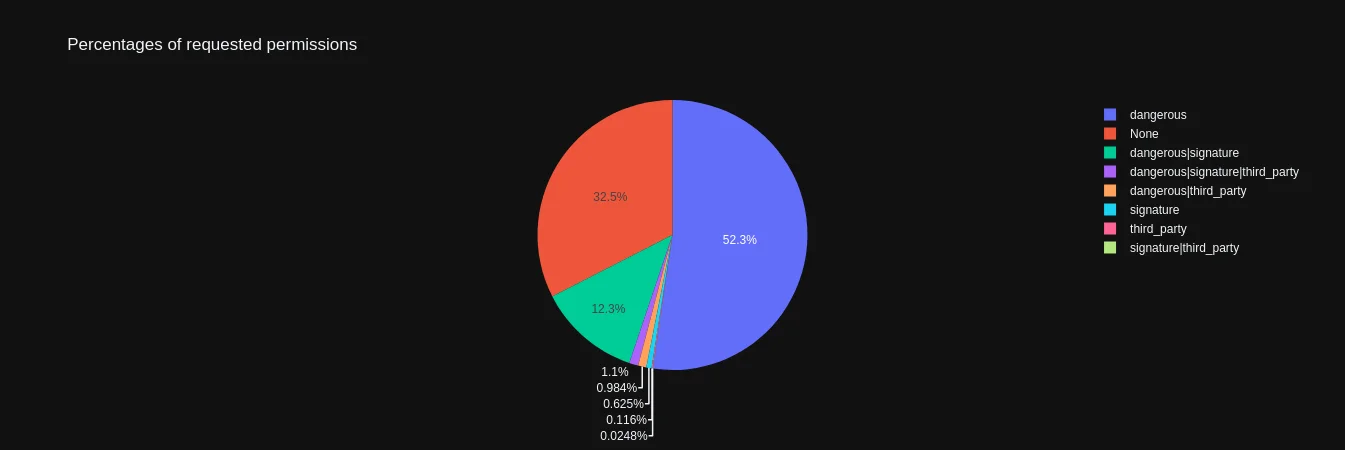
Let us now explain what we are seeing in this graph. As you might know there is some classification about the different permissions from Android itself. The different categories we have in this graph are: Dangerous, Signature and Third-Party. The first two refer to the "Protection Level" while the third one refers to a note stating: Not for use by third-party applications that can be found in some of the permissions. For example INSTALL_PACKAGES is one of that permissions that are not supposed to be used by third party application yet as it can be seen by the graph it is not really the case.
So we can see that approximately 50% of the apps request at least one permission that is classified as dangerous, 30% do not have a permission belonging to each of the three categories and 12% request a permissions that belong to the dangerous and the signature category.
Further, from a security standpoint, such a huge dataset may be used as an indicator of quality among the apps. For example, let us see how many applications request the permission to install other packages, which is a permission that third party applications should not request thus the user should be very suspicious if an application does. Surprisingly or not, that number is: 18022, if then we filter just these apps and sort them based on the number of downloads they have we get the following table:
| Number of Downloads | Number of apps |
|---|---|
| 5,000,000,000+ downloads | 2 |
| 10,000,000,000+ downloads | 2 |
| 500,000,000+ downloads | 6 |
| 1,000,000,000+ downloads | 9 |
| 100,000,000+ downloads | 28 |
| 50,000,000+ downloads | 29 |
| 0+ downloads | 107 |
| 5,000,000+ downloads | 108 |
| 10,000,000+ downloads | 134 |
| 500,000+ downloads | 285 |
| 1,000,000+ downloads | 431 |
| 5+ downloads | 597 |
| 1+ downloads | 611 |
| 50,000+ downloads | 658 |
| 100,000+ downloads | 953 |
| 5,000+ downloads | 1062 |
| 50+ downloads | 1260 |
| 500+ downloads | 1406 |
| 10,000+ downloads | 1894 |
| 10+ downloads | 2203 |
| 1,000+ downloads | 3071 |
| 100+ downloads | 3166 |
As can be seen the top three positions(starting from the bottom), are the "10+", "1000+" and "100+" downloads which means that these apps are not that famous or well known. So if there is an issue (privacy or security) about these apps it might not have been documented by a user.
Proceeding further and retrieving only the apps that have been published in the past days we have the following list:
| Application | Version | Released Date |
|---|---|---|
| alsultan.shell | 4.5.5.2302122059 | 2023-02-05 |
| game.ncjwi18njx881.mwk1ou3nxs2 | 1.0.0 | 2023-02-01 |
| com.calculator.vault.hide.photo.video.securevault | 1.0.2 | 2023-02-05 |
Interestingly there are only three results. Checking the applications on Play Store and immediately it is noticed that the third result no longer exists! The reason is unknown but after inspection(static analysis) of the APK it seemed like a repackaged application with adware purposes. Attempting to install the other two applications on a testing physical device failed with different errors in each case. This of course does not mean that the applications are malicious but it is definitely an indicator on the quality of the app.
Conclusion
Feel free to analyze on your own the figures and make your own conclusions. If this is of interest to you, and you have more ideas on what other graphs can be created using the units available, please reach out to me and let me know.